Simple tricks for optimizing VLM training
This post walks through some performance optimizations I applied to the training of a small Vision-Language Model (VLM) to output cations for images from the COCO dataset. The original model and training script is from seemore. These are simple tricks you can try for your own VLM training setup. The full code is at shinoss/optimizing-vlm.
Setup
Install dependencies
pip install -r requirements.txtTo download COCO dataset, the script will download from HuggingFace, so log into HF:
huggingface-cli loginTo run locally:
python train.pyTo run with Weights and Biases:
python train.py trainer_config.use_wandb=True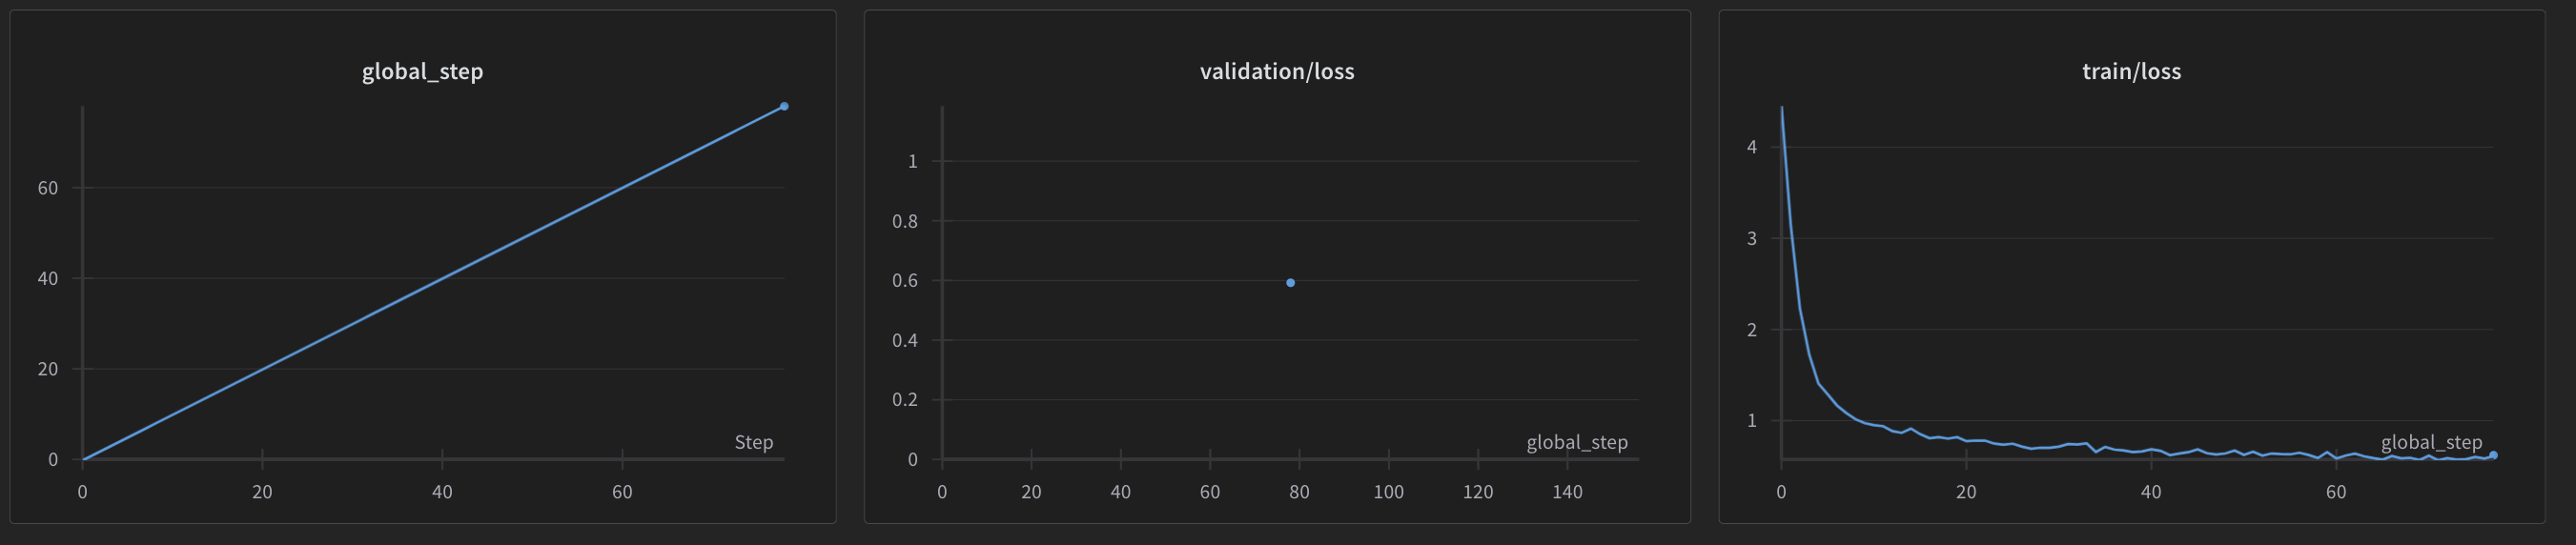
If you have multiple GPUs on a single node, you can also run Distributed Data Parallel (DDP) training:
torchrun --standalone --nproc_per_node=gpu --rdzv_id=456 --rdzv_backend=c10d --rdzv_endpoint=127.0.0.1:48123 train.pyNOTE: in the current state of the repo, DDP currently works with AMP (Automatic Mixed Precision) training (enabled by default) but not with CUDA graph.
Managing different run configs
I use Hydra to manage run configs. Currently I provide 2 train configs:
coco_train.yamlto train on subset of COCO captions RIW/small-cococsv_train.yamlto infinitely sample fromimages/inputs.csvcontaining 3 b64-encoded image and caption pairs.
You can use a different .yaml config file by specifying --config-name and --config-path
Profiling
Training script uses PyTorch’s built-in profiler. By default, no profiling is performed as it degrades performance.
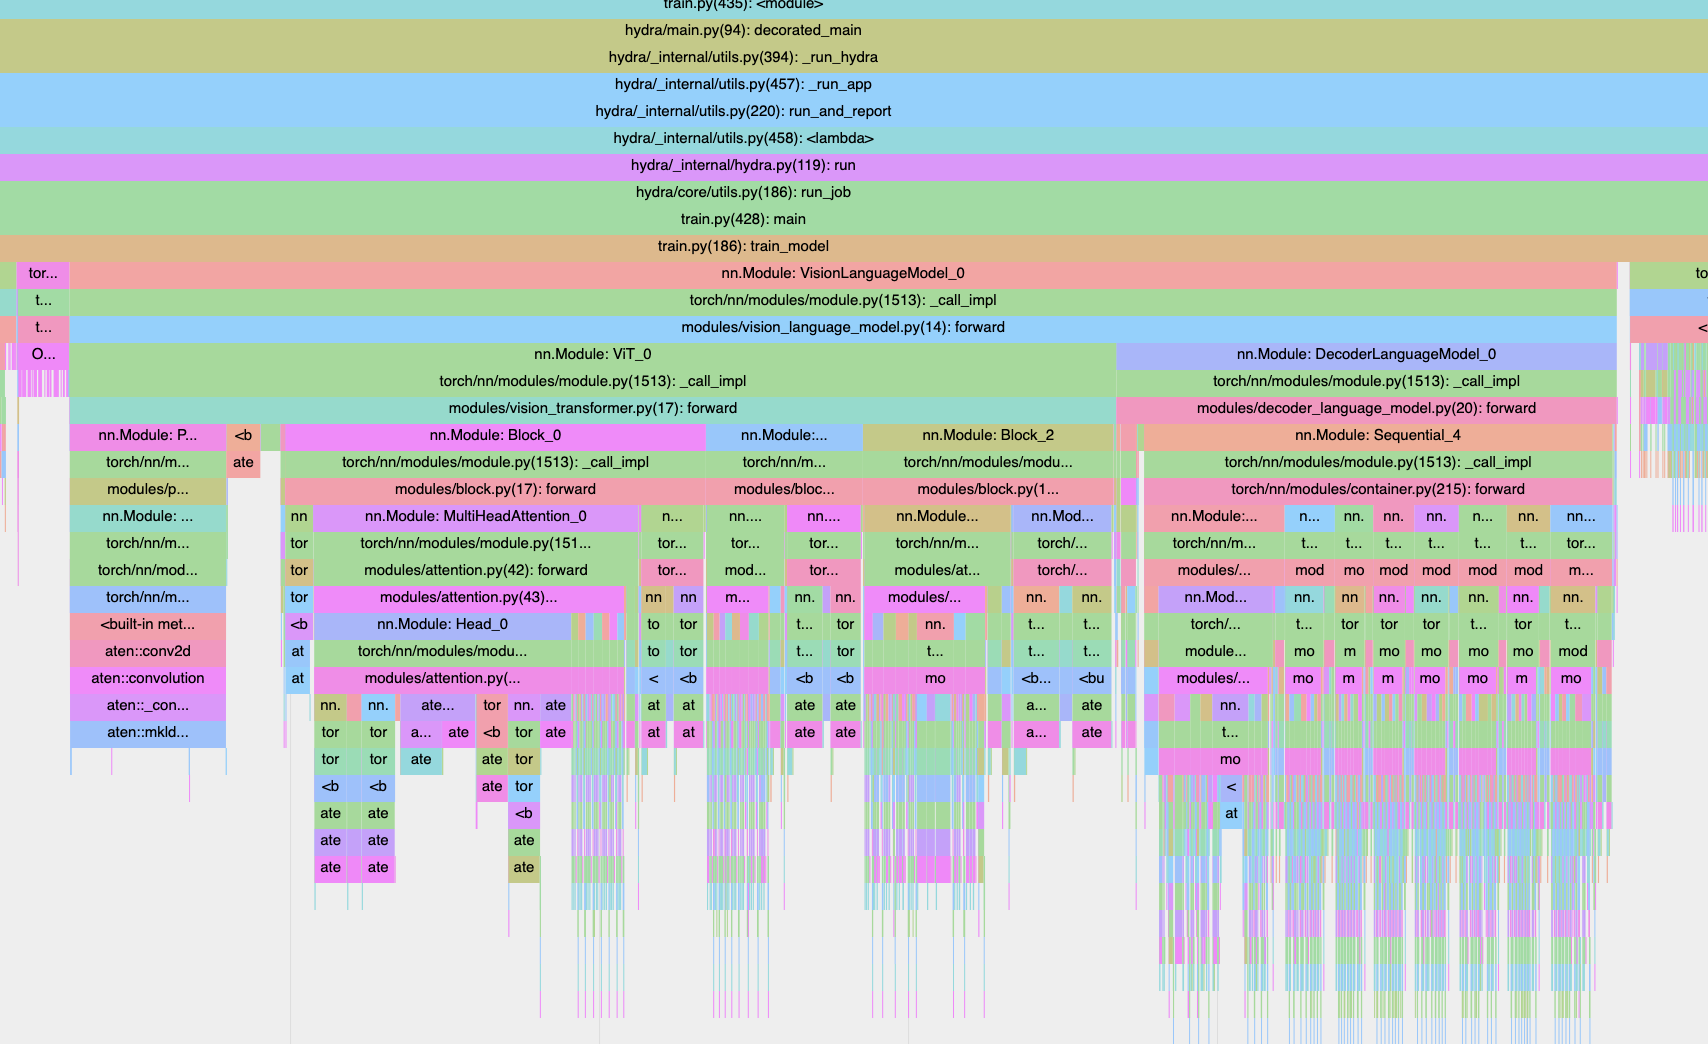
Tracing can be enabled by running with trainer_config.profiler_mode=trace to perform tracing and export a trace that can be viewed on chrome by loading the .json.gz file on chrome://tracing. An example trace:
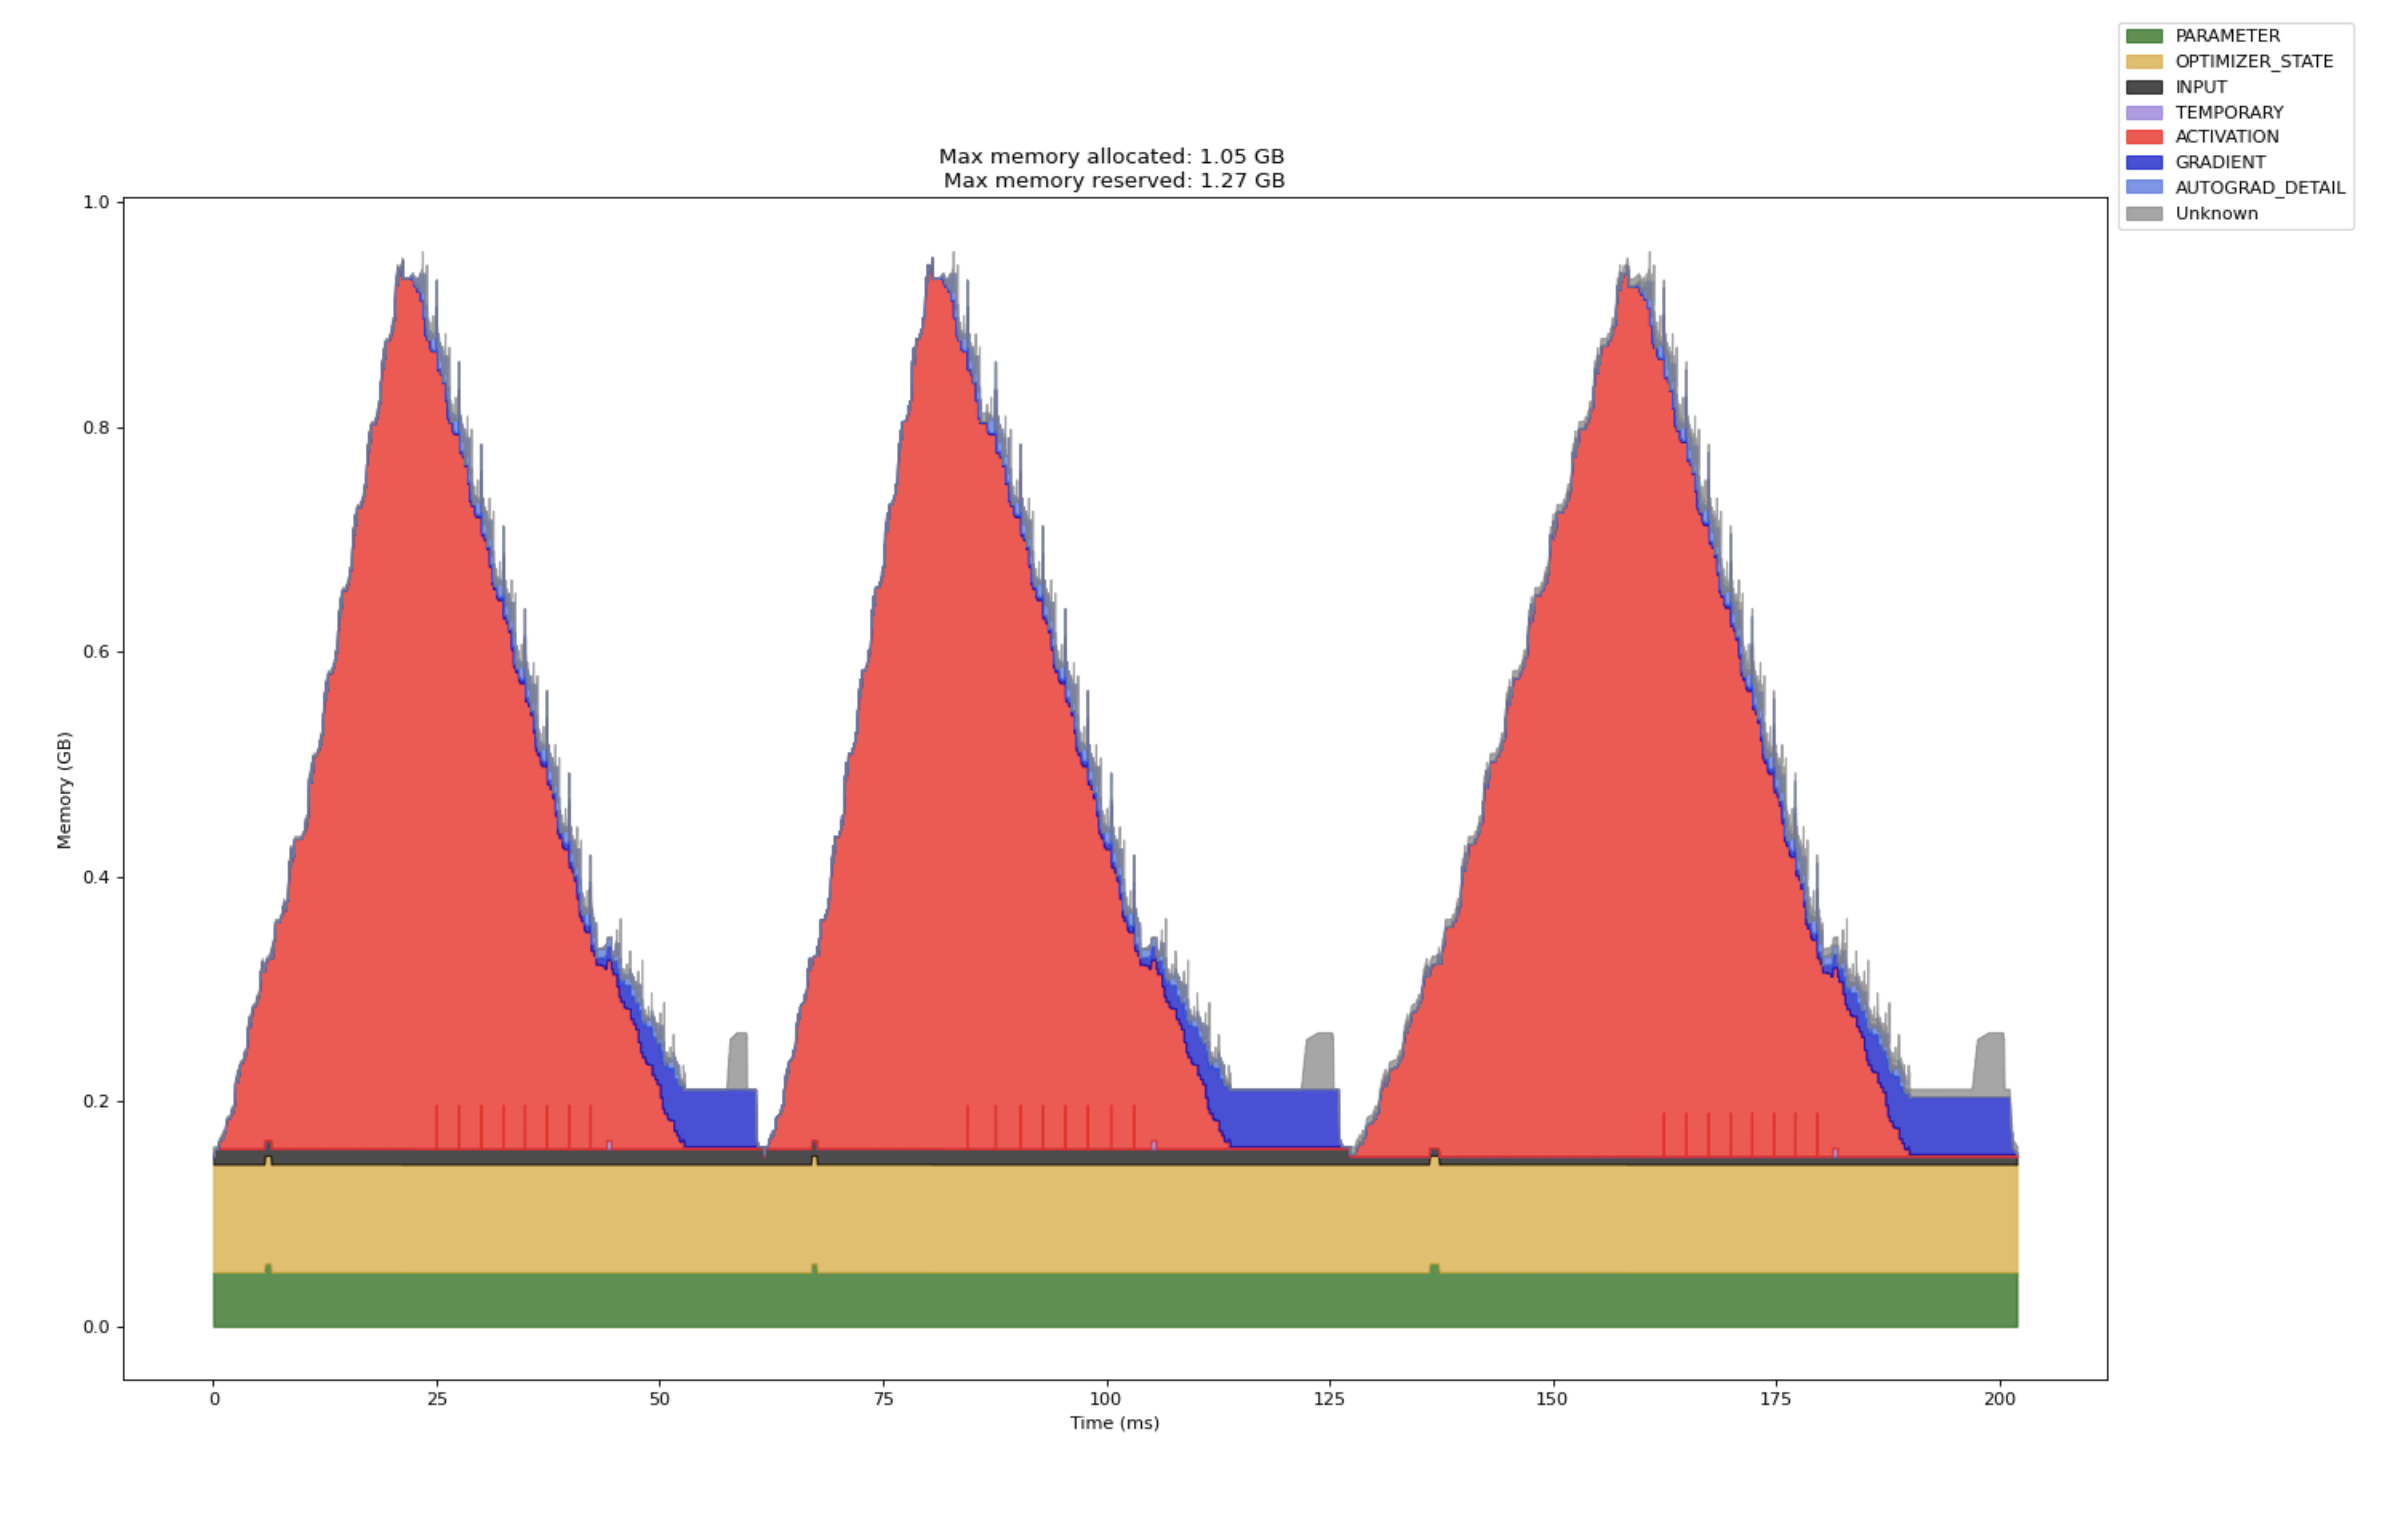
By running train.py with trainer_config.profiler_mode=memory, you can also enable memory profiling, which will additionally export a .html file with a memory timeline plot embedded as a PNG file.
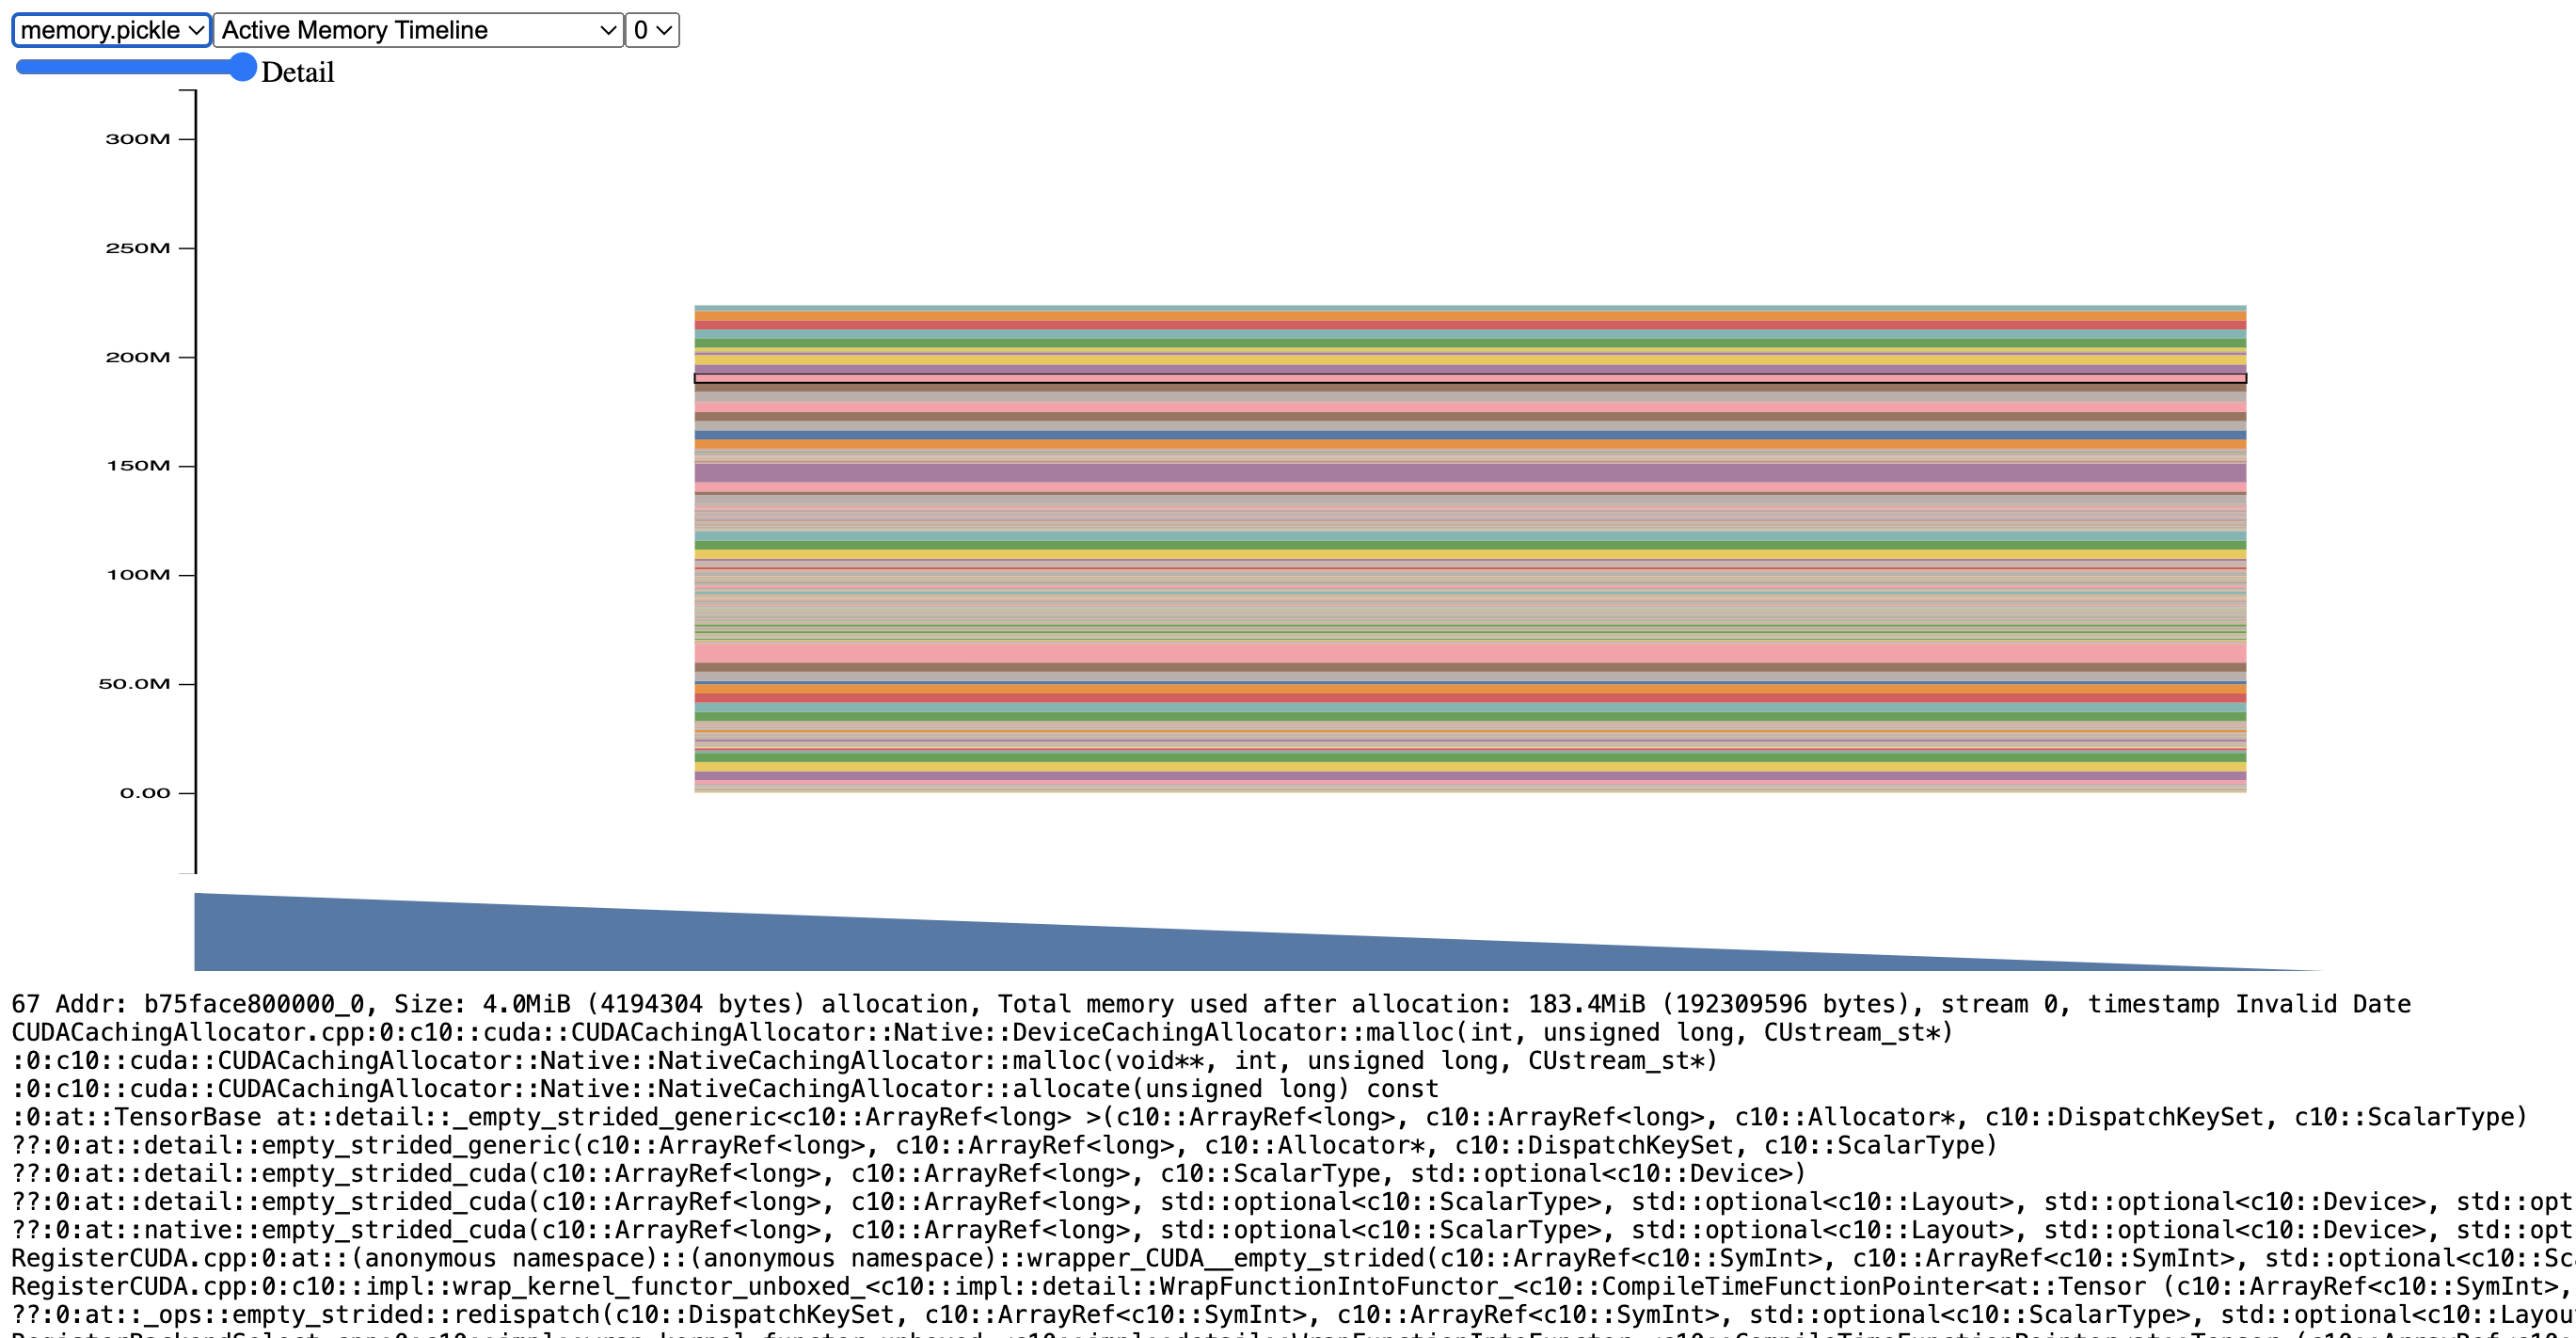
PyTorch also provides a way to generate memory snapshots for CUDA (see the docs), which can be viewed loaded at pytorch.org/memory_viz. However, I have not included these in my script because it didn’t seem to record the CUDA memory allocations correctly. Example:
NOTE: If running into issues when enabling
memoryprofiling, try removing the profiling scheduler and run on smaller iterations withtrainer_config.max_iters=10(or any small number).
Performance optimizations
Below are the performance optimizations I tried. All perf timings below were carried out on 1 x RTX 4000 Ada GPU unless specified otherwise (e.g. multi-GPU training)
1) Faster Dataloaders
Setting num_workers to be >0 (I’ve used 4) and setting pin_memory=True helps dataloading speed significantly. Refer to this PyTorch tutorial for how pinning memory helps.
On 1 epoch, 155 iterations run of COCO dataset, here are the total training durations before and after:
Before: 26.52 seconds
After: 15.75 seconds
Speedup: 1.68x
2) Enable CUDA Graph
This is an optimization that helps if using a low batch size such that training is mostly CPU bound.
When I initially checked the trace for a run with batch_size=16, I saw that we have low GPU utilisation with CPU launching many short kernels:
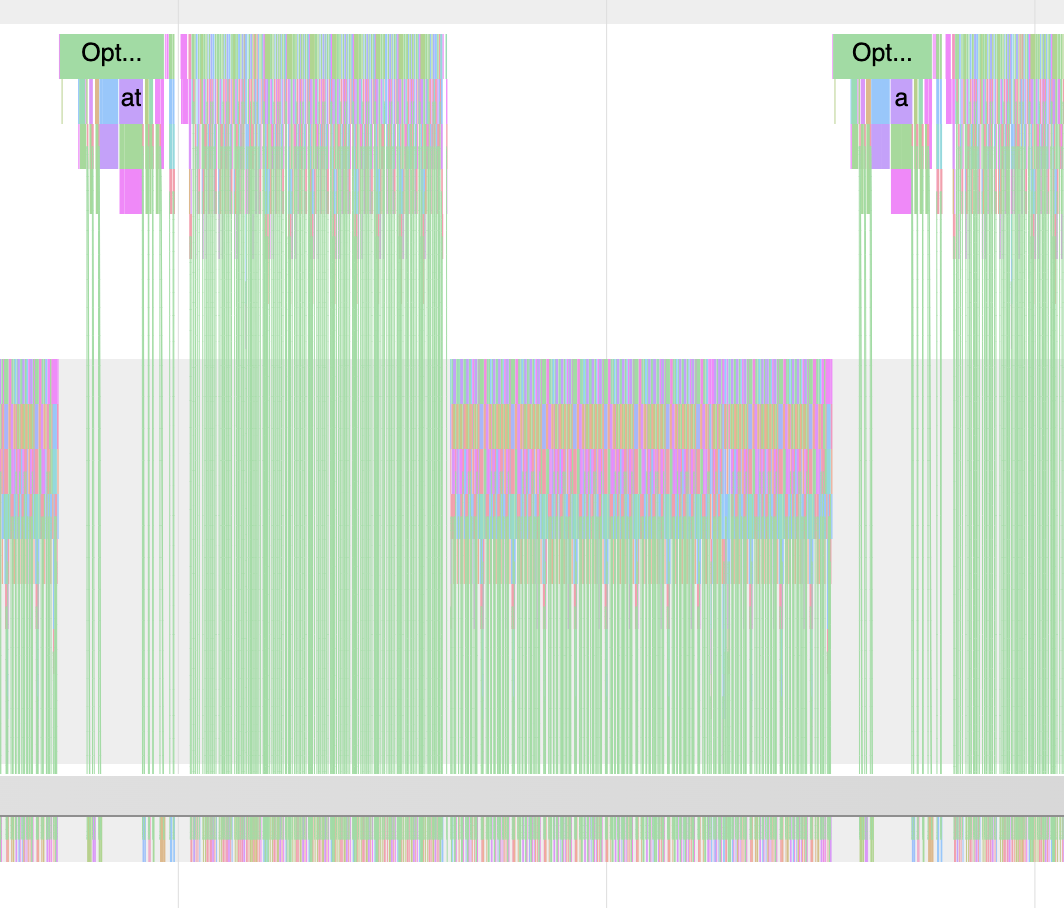
Enabling CUDA graph give significant performance here as it will record the kernel and replay this on the GPU without CPU launch overhead. See this link for more info about CUDA graphs.
After enabling CUDA graph on whole model, we see one single CUDA graph launch:
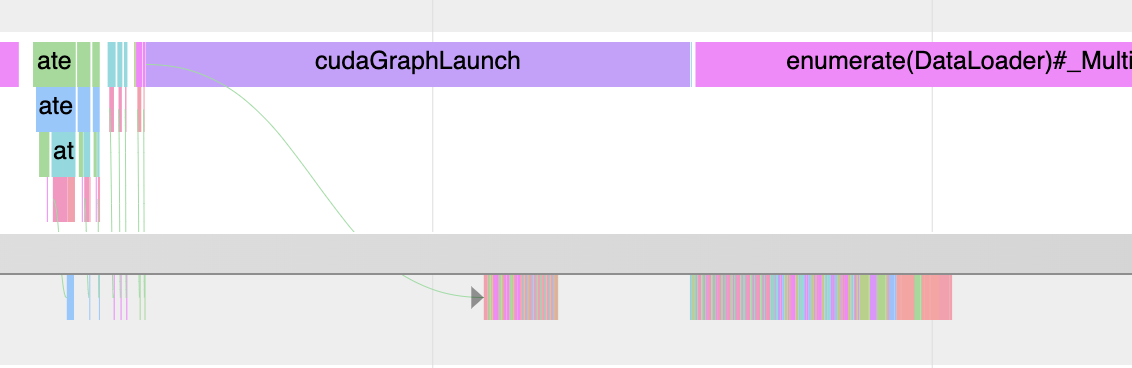
We get less CPU <-> GPU data transfers (notice how GPU kernels are packed close together now). We even get to overlap some of the GPU compute with CPU compute for data loading.
Using COCO dataset with batch size of 16, we get a decent speed improvement.
Without CUDA graph enabled
python train.py trainer_config.cuda_graph=True trainer_config.use_amp=False trainer_config.train_batch_size=16Results:
[rank 0] epoch 0, step 617, dt: 34.2877ms
[rank 0] epoch 0, step 618, dt: 34.3411ms
Epoch 0 running validation at global step 619
Validation Loss after epoch 0: 0.47926136255264284
[rank 0] Training time took 27.86 seconds
With CUDA graph enabled:
[rank 0] epoch 0, step 617, dt: 21.7195ms
[rank 0] epoch 0, step 618, dt: 21.7261ms
Epoch 0 running validation at global step 619
Validation Loss after epoch 0: 0.4788641661405563
[rank 0] Training time took 19.62 seconds
Time taken for each iteration went from 34ms -> 21ms, and total training time reduced from 27s -> 19s. For some reason, full-model CUDA graph doesn’t seem to be work with Automatic Mixed Precision with torch.cuda.amp.autocast so the run needs to disable amp: python train.py trainer_config.cuda_graph=True trainer_config.use_amp=False.
NOTE: To enable this on COCO dataset, I needed to pad each batch to have the same trainer_config.max_seq_length sequence length, as CUDA graph doesn’t work if you have dynamic input shapes. I did some analysis of the COCO dataset and found that 255 is the max length across all ~8k training samples, but rounded it up to 256 since it’s a nice power of 2.
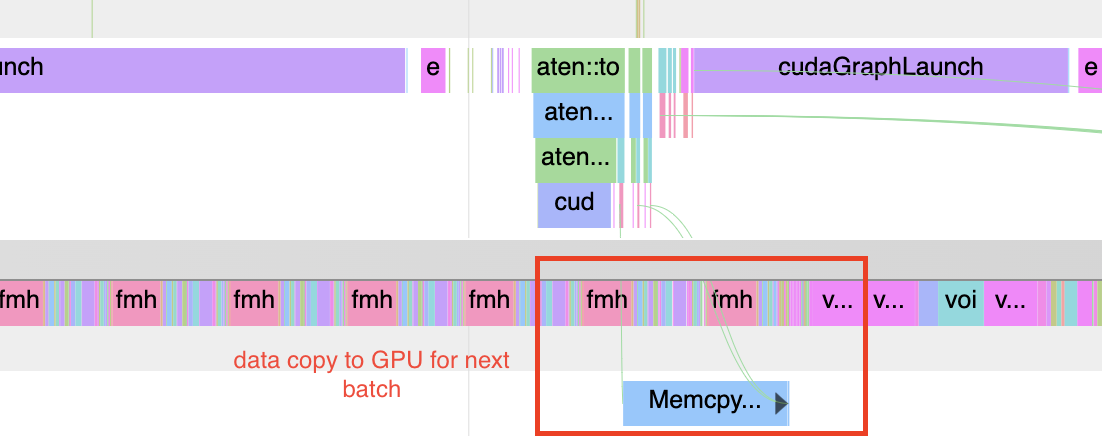
3) Prefetching data to overlap host->device data copy and compute
We can prefetch a batch with data.to(non_blocking=True) on a separate CUDA stream so CPU isn’t blocked.
4) Enabling TensorFloat32 (TF32) mode
Ampere and later devices can do matrix multiplications faster using TF32. This is enabled by default for convolutions but not for matrix multiplications. Enabling these allow GPUs that support it to make use of Tensor Cores.
torch.backends.cuda.matmul.allow_tf32 = True
torch.backends.cudnn.allow_tf32 = True
On 1 x RTX 4000 Ada GPU, I got a good speed up from enabling this:
Without TF32:
[rank 0] epoch 0, step 153, dt: 87.7135ms
[rank 0] epoch 0, step 154, dt: 88.4426ms
Epoch 0 running validation at global step 155
Validation Loss after epoch 0: 0.543974132835865
[rank 0] Training time took 18.99 seconds
With TF32:
[rank 0] epoch 0, step 153, dt: 74.3794ms
[rank 0] epoch 0, step 154, dt: 74.4398ms
Epoch 0 running validation at global step 155
Validation Loss after epoch 0: 0.5439731180667877
[rank 0] Training time took 17.03 seconds
5) bf16/fp16 mixed precision training
These are applied with torch.cuda.amp.autocast and toggled with trainer_config.use_amp=True/False. For fp16, we need to scale the gradients accordingly. The training script uses bf16 if the hardware supports it.
For mixed precision training to have non-trivial speed ups, we need to saturate the GPU. For COCO dataset (--config-name coco_train.yaml), I tried BF16 autocasting on batch size of 64 and saw further performance improvements compared to the with-TF32 baseline above.
With BF16 (+TF32):
python train.py trainer_config.use_amp=True
...
[rank 0] epoch 0, step 151, dt: 40.9811ms
[rank 0] epoch 0, step 152, dt: 40.4835ms
[rank 0] epoch 0, step 153, dt: 37.3769ms
[rank 0] epoch 0, step 154, dt: 39.1674ms
Epoch 0 running validation at global step 155
Validation Loss after epoch 0: 0.5439773529767991
[rank 0] Training time took 12.44 seconds
Time taken for each iteration went from ~74ms -> ~40ms, with total training time for 155 iterations reducing from 17->12 seconds.
NOTE: Currently CUDA graph doesn’t seem work with AMP, so the script will fail if cuda_graph=True and use_amp=True on least on RTX 4000 Ada.
6) torch.compile
We don’t need it for a simple model like this, but torch.compile can also generate CUDA graphs automatically when running with mode='reduce-overhead'. However, this mode causes segmentation fault for this model and I haven’t had time to debug why :p
In my experiments, torch.compile didn’t result in a significant speed up, likely because the model is already quite simple. Nevertheless, I added a flag to run training with mode='default' torch.compile:
python train.py 'trainer_config.compile=True'NOTE: first forward pass will be significantly slower as Pytorch has to first compile the model.
NOTE: original script uses batch size of 16 for train, and 8 for validation. The different input shape will trigger recompile during when calculating validation loss unless we make batch size the same for train and validation
7) Use FlashAttention
Current model uses custom multi-head attention modules in modules/attention.py.
I rewrote this to use F.scaled_dot_product_attention, which uses FlashAttention (FA) by default. This results in significant speed up, especially at larger batch sizes. The comparison below is for batch_size=64 and use_graph=True:
python train.py trainer_config.cuda_graph=False trainer_config.use_amp=TrueWith batch_size=64 and not using FlashAttention:
[rank 0] epoch 0, step 153, dt: 116.4682ms
[rank 0] epoch 0, step 154, dt: 116.1888ms
Epoch 0 running validation at global step 155
Validation Loss after epoch 0: 0.5457157269120216
[rank 0] Training time took 26.54 seconds
Switching to FlashAttention implementation
[rank 0] epoch 0, step 153, dt: 43.6299ms
[rank 0] epoch 0, step 154, dt: 43.6220ms
Epoch 0 running validation at global step 155
Validation Loss after epoch 0: 0.5439692437648773
[rank 0] Training time took 12.10 seconds
Switching to FA (on single RTX 4090) reduces each iteration from 110ms -> 43ms, 2.5x improvement.
8) Enable NVIDIA cuDNN auto-tuner for improved convolution performance (YMMV)
torch.backends.cudnn.benchmark = TrueThe auto-tuner will run a short benchmark and select kernel w/ best perf given model inputs. However, I didn’t see much difference in performance in practice, perhaps because convolutions in ViT are a relatively small part of the overall VLM.
9) Data Parallel training
I use 2 x RTX4090 to run DDP training, with batch size of 64.
Single-node GPU training:
[rank 0] epoch 0, step 153, dt: 45.4826ms
[rank 0] epoch 0, step 154, dt: 45.5353ms
Epoch 0 running validation at global step 155
Validation Loss after epoch 0: 0.5439750000834465
[rank 0] Training time took 11.99 seconds
With DDP:
[rank 1] epoch 0, step 76, dt: 98.8824ms
[rank 0] epoch 0, step 77, dt: 98.8553ms
[rank 1] epoch 0, step 77, dt: 98.9511ms
[rank 1] Training time took 14.26 seconds
Epoch 0 running validation at global step 78
Validation Loss after epoch 0: 0.5921480029821395
[rank 0] Training time took 15.39 seconds
Each iteration now takes ~98ms up from ~70ms for single-node training, due to DDP overhead such as All-Reduce on backward. However, there are now 2 GPUs each processing half the number of batches (155). With 2 GPUs, single-node training seems faster, though it probably can be optimized further.
One added benefit of DDP is that you can process the same amount of data per iteration by using a smaller batch size on each rank, which reduces the memory of activations (which is proportional to batch size).
Final results
On a single RTX 4000 Ada GPU, training on COCO training data of ~8k samples with batch size 64 for 1 epoch takes ~41 seconds without the aforementioned performance optimizations:
[rank 0] epoch 0, step 153, dt: 133.6944ms
[rank 0] epoch 0, step 154, dt: 108.5243ms
Epoch 0 running validation at global step 155
Validation Loss after epoch 0: 0.5456113658845425
Epoch 0 | Saved training snapshot at /root/seemore/seemore-submission-main/snapshots/00_snapshot.pt
[rank 0] Training time took 41.11 seconds
Final results, combining perf results discussed above (but without CUDA graph / compile, using mixed precision bf16). Results when running on 2 x RTX 4000 Ada GPUs:
[rank 0] epoch 0, step 77, dt: 98.5072ms
[rank 1] epoch 0, step 77, dt: 98.4292ms
[rank 1] Training time took 13.58 seconds
Epoch 0 running validation at global step 78
Validation Loss after epoch 0: 0.5921374052762985
Epoch 0 | Saved training snapshot at /root/seemore/seemore-submission-main/snapshots/00_snapshot.pt
[rank 0] Training time took 14.31 seconds
For single (1 x RTX 4000 Ada) GPU training:
[rank 0] epoch 0, step 153, dt: 44.0307ms
[rank 0] epoch 0, step 154, dt: 47.2314ms
Epoch 0 running validation at global step 155
Validation Loss after epoch 0: 0.5439842417836189
Epoch 0 | Saved training snapshot at /root/seemore/seemore-submission-main/snapshots/00_snapshot.pt
[rank 0] Training time took 12.56 seconds
Here's what the DDP training looks like:
Where to go from here
Below are some other things I would've tried next if I had the time:
- Tensor cores on Volta+ GPUs prefer NHWC tensor layout, where channel dim is last. See the NVIDIA docs.
- Didn’t implement but useful for scaling: FSDP (ZeRO 3, sharding parameters, gradients and optimizer states), tensor parallelism, pipeline parallelism
- Make CUDA graph + DDP and CUDA graph + AMP work. Both don’t work currently.
Hope that helps! Again, the full code can be found at shinoss/optimizing-vlm.